




હોસ્પિટલ કંપનીઓના શેર્સ કેટલા મોંઘા? 38 શેરનું વેલ્યુએશન એનાલિસિસ
ભારતનું હેલ્થકેર માર્કેટ ₹12.2 લાખ કરોડનું છે અને તેમાં વૃદ્ધિની અપાર તક છે. આ માર્કેટમાં અનેક હોસ્પિટલ કંપનીઓ સક્રિય છે અને વૃદ્ધિની ઊંચી તકને કારણે આ કંપનીઓના શેર્સના વેલ્યુએશન પણ ઊંચકાઈ ગયા છે. રોકાણકારોએ આવી સ્થિતિમાં શું કરવું તે સમજીએ.

desk@kuberanow17 Aug 2026



ભારતમાં Hospital stocks માટે ગ્રોથની સ્ટોરી જેટલી મજબૂત છે, વેલ્યુએશનનો સવાલ હવે એટલો જ મોટો બન્યો છે. ભારતીય હેલ્થકેર ડિલિવરી માર્કેટ FY26માં અંદાજે ₹7.6–7.8 લાખ કરોડનું છે અને FY30 સુધી 10–12% CAGRથી વધીને ₹11.2–12.2 લાખ કરોડ સુધી પહોંચી શકે છે. (સ્રોતઃ Manipal Health Enterprisesના Red Herring Prospectusમાં સામેલ CRISIL Report) બીજી તરફ listed hospital companiesના વેલ્યુએશનમાં છેલ્લા 2 વર્ષમાં લગભગ 51%નો વધારો થઈ ચૂક્યો છે. હવે રોકાણકાર સામે મોટો સવાલ એ નથી કે hospital sectorની વૃદ્ધિ થશે કે નહીં, પરંતુ સવાલ એ છે કે આ વૃદ્ધિની સાથે કઈ હોસ્પિટલ કંપનીના શેર્સ તાલ મિલાવી શકે છે? ઘણા શેર્સ તો અત્યારથી જ અતિ ઊંચા પ્રીમિયમ લેવલે પહોંચી ગયા છે, જેના લીધે રોકાણકારો માટે નિર્ણય લેવાનું મુશ્કેલ બન્યું છે.
વેલ્યુએશનમાં મોટો તફાવત
17 August 2026ના રોજ ઉપલબ્ધ માહિતીના આધારે, Apollo Hospitals લગભગ 60.3x P/E ધરાવે છે. Max Healthcare 65.2x, Fortis Healthcare 63.9x અને Global Health 66.5x પર ટ્રેડ થાય છે. પરંતુ Manipal Health લગભગ 104.9x, Krishna Institute of Medical Sciences લગભગ 161.2x, Aster DM Quality Care લગભગ 197.8x અને HealthCare Global Enterprises લગભગ 220.9x P/E સુધી પહોંચી ગયા છે. બીજી તરફ Indraprastha Medical માત્ર 18.1x, Kovai Medical Center 26.1x અને GPT Healthcare 26.6x પર છે.
વેલ્યુએશનમાં આટલા મોટા તફાવતથી એક વાત સ્પષ્ટ થાય છે કે, Hospital sectorમાં માત્ર આજની કમાણી નહીં, પરંતુ ભવિષ્યમાં કંપનીઓ bedsની સંખ્યા વધારવામાં, occupancy હાંસલ કરવામાં, ARPOB, specialty mix અને consolidation opportunityના મોરચે કેવું પ્રદર્શન કરશે તે બાબત પણ price-in થઈ ગઈ છે.
₹4 લાખ કરોડથી વધુની તક
ભારતીય હેલ્થકેર ડિલિવરી માર્કેટ FY26ના ₹7.6–7.8 લાખ કરોડથી વધીને FY30 સુધી ₹11.2–12.2 લાખ કરોડ થઈ શકે છે. આમ, આગામી 4 વર્ષમાં આશરે ₹4 લાખ કરોડથી વધુનો incremental revenue pool ઊભો થવાની સંભાવના છે.
આ ગ્રોથમાં hospital operators માટે સૌથી મહત્વની બાબત એ છે કે FY26માં value termsમાં ઇન-પેશન્ટ સર્વિસિસનો share 71–72% હતો. આઉટ-પેશન્ટ volumes વધુ હોવા છતાં હેલ્થકેર ફેસિલિટીઝની મોટાભાગની આવક ઇન-પેશન્ટ સારવારમાંથી આવે છે. એટલે occupancyમાં થોડો વધારો, complex proceduresનો share વધવો અને ARPOBમાં સુધારો hospital companiesના EBITDA પર મોટી અસર કરી શકે છે.
આ જ કારણથી hospital stocksને બજારમાં સામાન્ય service companies કરતાં ઊંચો PE મલ્ટિપલ મળે છે.
સૌથી મોટો trigger
FY26માં મોટા કદની ખાનગી હોસ્પિટલ્સ પાસે સમગ્ર હોસ્પિટલ માર્કેટનો માત્ર 20% હિસ્સો હતો. CRISILના અંદાજ પ્રમાણે, ખાનગી હોસ્પિટલ્સનો treatment value share FY20ના 64%થી વધીને FY30 સુધી લગભગ 69% થઈ શકે છે, એટલે કે, Apollo Hospitals, Max Healthcare, Fortis Healthcare, Manipal Health, Narayana Hrudayalaya, Aster DM Quality Care, KIMS અને Global Health જેવી organised chains પાસે માત્ર market growthનો જ નહીં પરંતુ unorganised અને smaller hospitals પાસેથી market share મેળવવાની આકર્ષક તક છે. આથી, મોટા કદની હોસ્પિટલ ચેઈન કંપનીઓ માટે આજનું ઊંચું વેલ્યુએશન એક હદ સુધી consolidation premium છે.
આગામી હરીફાઈ નાના શહેરોમાં થશે
FY26માં દેશનાં હેલ્થકેર માર્કેટમાં મેટ્રો શહેરોનો હિસ્સો માત્ર 20–25% હતો જ્યારે નોન-મેટ્રો શહેરોનો હિસ્સો 75–80% હતો. મધ્યમ વર્ગનું વધતું કદ, લોકોમાં આરોગ્ય સંબંધિત જાગરૂકતા અને secondary તથા tertiary careમાં ખાનગી રોકાણ વધવાથી નાના શહેરોમાં વૃદ્ધિદર ઊંચો છે. આ આંકડો listed hospital companiesની aggressive bed-addition plans સમજવામાં મહત્વનો છે. Indium Capitalના July 2026 hospital valuation update પ્રમાણે listed hospital companiesએ છેલ્લા 2 વર્ષમાં અંદાજે 8,000 beds ઉમેર્યા છે. તેમાં Fortis Healthcareએ 1,483, KIMSએ 1,349, Max Healthcareએ 1,179, Yatharth Hospitalsએ 950, Global Healthએ 775 અને Aster DM Quality Careએ 763 bedsનો ઉમેરો કર્યો છે. જોકે, કંપનીઓએ કેટલી પથારીઓ ઉમેરી તેના કરતાં આ કંપનીઓ આગામી વર્ષોમાં કેટલી નવી પથારીઓ ઉમેરશે અને તેના કારણે તેમની ક્ષમતામાં કેટલો વધારો થશે, તેને ધ્યાનમાં રાખીને સ્ટોક્સનું વેલ્યુએશન નક્કી થાય છે.
EV/EBITDA 28x અને પ્રીમિયમ 34x
Hospital companiesનું comparison માત્ર P/Eથી કરવું પૂરતું નથી. Hospital business કેપિટલ-ઇન્ટેન્સિવ છે અને નવી હોસ્પિટલ શરૂ થયા પછી શરૂઆતના વર્ષોમાં depreciation, interest cost અને ramp-up lossesને કારણે કંપનીઓના પ્રોફિટ આફ્ટર ટેક્સ (PAT) દબામાં રહી શકે છે. તેથી વેલ્યુએશન માટે EV/EBITDA અને EV/Bedના મલ્ટિપલ્સ પણ મહત્વના છે.
Indium Capitalના July 2026 update પ્રમાણે listed hospitals સરેરાશ લગભગ 28x EV/EBITDA અને ₹7 crore EV/Bed પર valued હતા. High-ARPOB chains લગભગ 33x EV/EBITDA, જ્યારે mid-ARPOB chains લગભગ 24x પર હતા. Scale પ્રમાણે large hospital chains લગભગ 34x, જ્યારે small chains લગભગ 22x EV/EBITDA પર valued હતા.
અર્થાત્ વિસ્તરણ માટે બજાર લગભગ 55% જેટલું EV/EBITDA premium ચૂકવી રહ્યું છે.
આ premium પાછળ operating leverage મહત્વનું છે. મોટી chains doctor ecosystem, procurement, brand, insurance tie-ups, specialty mix અને capital accessમાં નાના hospitals કરતાં વધુ મજબૂત સ્થિતિમાં હોય છે.
વેલ્યુએશનના મોરચે સરખામણી
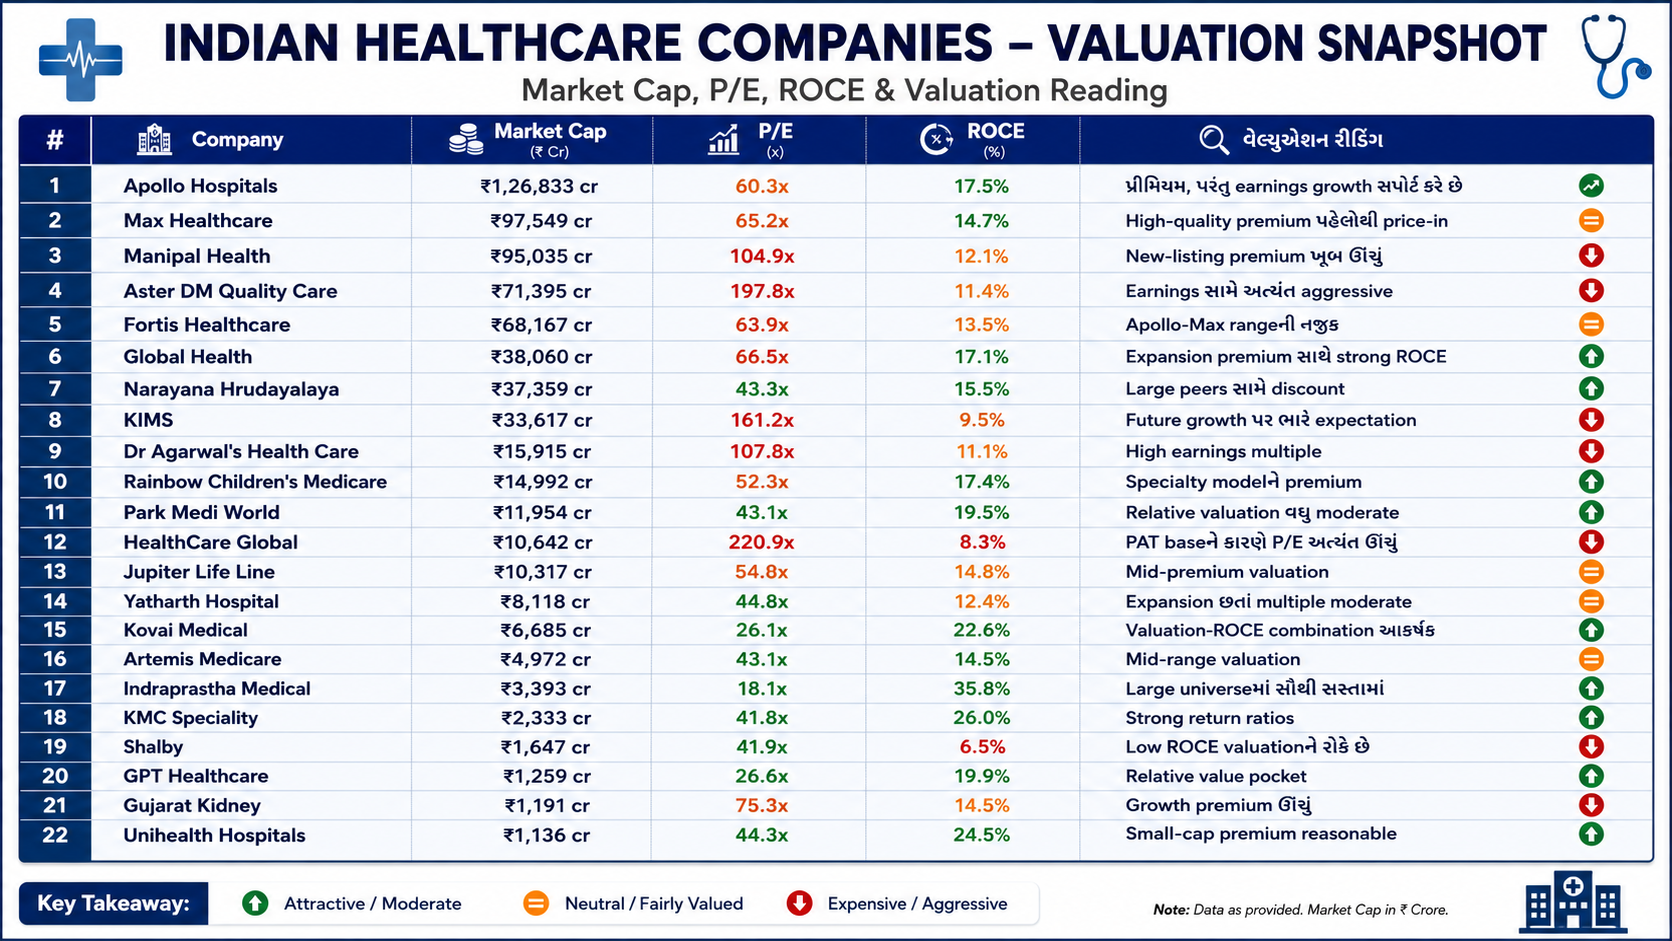
17 August 2026ના Screener data પ્રમાણે major listed hospital companiesનું P/E અને market-cap picture આ પ્રમાણે છે.
Apollo Hospitals: premium છે, પરંતુ execution પણ છે
Apollo Hospitals લગભગ 60.3x P/E પર છે. Absolute basis પર આ સસ્તુ નથી, પરંતુ KIMS, Manipal Health અને Aster DM Quality Careની સરખામણીએ valuation ઘણું ઓછું aggressive છે.
June 2026 quarterમાં Apollo Hospitalsનો consolidated net profit 34% વધીને ₹581 crore અને revenue 20.6% વધીને ₹7,043 crore થઈ હતી. Hospital occupancy 65%થી વધીને 70% થઈ. કંપની પાસે લગભગ 10,000 beds છે અને આગામી 5 વર્ષમાં 5,800થી વધુ beds ઉમેરવાની યોજના છે. એટલે Apolloનું premium valuation તેની earnings delivery સાથે આવે છે. જોકે આટલી મોટી expansionને કારણે capex execution અને new-bed ramp-up હવે stock માટે મુખ્ય variables રહેશે.
Max Healthcare: quality સારી, પરંતુ valuationમાં error માટે જગ્યા ઓછી
Max Healthcare લગભગ 65.2x P/E પર છે અને સૌથી મોટી લિસ્ટેડ કંપનીઓમાં સ્થાન ધરાવે છે. જૂન-2026 ક્વાર્ટરમાં કંપનીની આવક લગભગ 16.7% વધી હતી. મેટ્રો શહેરોમાં હાજરી, ઊંચો ARPOB અને મજબૂત બ્રાન્ડને કારણે તેને બજારમાં પ્રીમિયમ વેલ્યુએશન મળે છે. પરંતુ જ્યારે પહેલેથી જ તેનો સરેરાશ EV/EBITDA 34x જેવા ઊંચા સ્તરે હોય ત્યારે નવી ક્ષમતા કાર્યરત થવામાં અથવા ઓક્યુપન્સીનો ગ્રોથ ધીમો પડવાના કિસ્સામાં તેના વેલ્યુએશનમાં ઘટાડો થવાની શક્યતા વધી જાય છે.
Manipal Health: IPO વખતે P/E 84.65x પણ IPO બાદ 105x
Manipal Healthનો P/E IPOના ₹590ના ભાવે લગભગ 84.65x હતો. તે સમયે પણ analystsએ valuationમાં growthનો મોટો ભાગ price-in થયેલો હોવાનું જણાવ્યું હતું. હવે share price ₹722.90 સુધી પહોંચતાં trailing P/E લગભગ 104.9x થઈ ગયો છે—IPO upper band કરતાં શેર લગભગ 22.5% ઉપર છે.પણ Manipalનું scale પણ મોટું છે. RHP પ્રમાણે 31 March 2026એ company Indiaની largest pan-India multispecialty hospital network by bed capacity હતી. તેની પાસે pro-forma basis પર 49 hospitals, 13,037 licensed beds અને 6,878 operational bed હતા. Company આગામી 3–4 વર્ષમાં લગભગ ₹4,000 cr ખર્ચીને 2,400 beds ઉમેરવાની યોજના ધરાવે છે.
અહીં valuation case સ્પષ્ટ છે: Manipal પાસે scale અને expansion visibility છે, પરંતુ 105x P/E પર executionમાં disappointment માટે cushion બહુ ઓછું છે.
Specialty mix પણ premium નક્કી કરે છે
બધા beds સરખા revenue generate કરતા નથી. Complex specialties ધરાવતા hospital networksનો ARPOB અને EBITDA સામાન્ય hospitals કરતાં વધુ હોઈ શકે છે.
CRISIL Report પ્રમાણે FY26માં cardiac sciencesનો 17% હિસ્સો, oncologyનો 12%, orthopedicsનો 11% જ્યારે neurosciences, gastro sciences અને renal sciences દરેકનો લગભગ 9% હિસ્સો હતો.
Manipal Healthમાં પણ cardiac, oncology, neurosciences, gastro, orthopedics અને renal sciences—CONGO-R specialties—FY26ના pro-forma gross inpatient revenueના 64.09% હતા. આ જ કારણસર Apollo, Max, Manipal, Fortis અને Global Health જેવી tertiary અને quaternary care-focused chainsને generic bed operators કરતાં premium મેળવવામાં મદદ કરે છે.
Narayana, Park, Kovai અને GPT: relative value ક્યાં દેખાય છે?
જો investor માત્ર absolute P/E નહીં પરંતુ sector-relative valuation જુએ તો કેટલાક stocks અલગ દેખાય છે. Narayana Hrudayalaya લગભગ 43.3xના P/E પર છે—Apollo, Max, Fortis અને Global Health કરતાં નોંધપાત્ર discount. Latest quarterમાં તેનો sales growth 78% હતો, જોકે તેમાં business mix અને consolidation effectsને અલગથી સમજવા જરૂરી છે.
Park Medi World લગભગ 43.1x P/E સાથે 19.3% ROCE આપે છે. Kovai Medical માત્ર 26.1x P/E છતાં ROCE લગભગ 22.6% છે. GPT Healthcare લગભગ 26.6x P/E અને 19.9% ROCE પર છે. આ stocks મોટી હોસ્પિટલ ચેઈન્સની જેમ સમગ્ર દેશમાં હાજરી ધરાવતા નથી, પરંતુ વેલ્યુએશન સારા સ્તરે હોવાથી જો આ કંપનીઓ ઓપરેશન્સના મોરચે સારું પ્રદર્શન કરે તો તેમના શેરનું re-rating થવાની શક્યતા વધારે રહે છે.
Indraprastha Medical: વેલ્યુએશનના મોરચે આગળ
Indraprastha Medical લગભગ 18.1xનો P/E અને 35.8% ROCE ધરાવે છે અને વિશાળ કદની હોસ્પિટલ કંપનીઓ સામે વેલ્યુએશનના મોરચે મજબૂત સ્થાન ધરાવે છે. Market cap માત્ર ₹3,393 crore હોવાથી scale અને geographical concentrationને કારણે તેને Apollo-Max જેવા multiples મળતા નથી. પરંતુ આ કંપનીનો દાખલો દર્શાવે છે કે હોસ્પિટલ સેગમેન્ટમાં દાવ લગાવવા માટે રોકાણકારે ફરજિયાત 60–100x earnings ચૂકવવી પડે એ જરૂરી નથી.
Aster, KIMS અને HCGમાં growth expectations સૌથી ઊંચી
Aster DM Quality Care લગભગ 197.8x P/E, KIMS 161.2x અને HealthCare Global લગભગ 220.9x પર છે. આ ત્રણેયના વર્તમાન earnings multiples સમગ્ર સેક્ટરની સરેરાશ કરતાં ઘણા ઊંચા છે.
KIMSમાં latest quarterly sales લગભગ 35.3% વધી હતી, પરંતુ profit લગભગ 47.2% ઘટ્યો હતો. Aster DM Quality Careમાં sales 21.6% વધી હોવા છતાં quarterly profitમાં લગભગ 46.1% ઘટાડો થયો હતો. HCGનો latest profit growth 189.9% રહ્યો, પરંતુ earnings base હજુ નાનું હોવાથી P/E ઊંચું રહે છે. એટલે high P/Eને હંમેશા “overvalued” કહેવું યોગ્ય નથી, પરંતુ આવા stocksમાં future earnings growthની requirement ઘણી વધારે રહે છે.
38 Hospital stocks: સંપૂર્ણ P/E વેલ્યુએશન મેપ
Screenerની Hospital categoryમાં હાલમાં 38 companies છે. તેમાં micro-cap અને SME companiesને large institutional hospital chains સાથે સીધી રીતે compare કરવી યોગ્ય નથી, પરંતુ આખા sectorમાં valuation dispersion કેટલું મોટું છે તે નીચેના bands બતાવે છે.
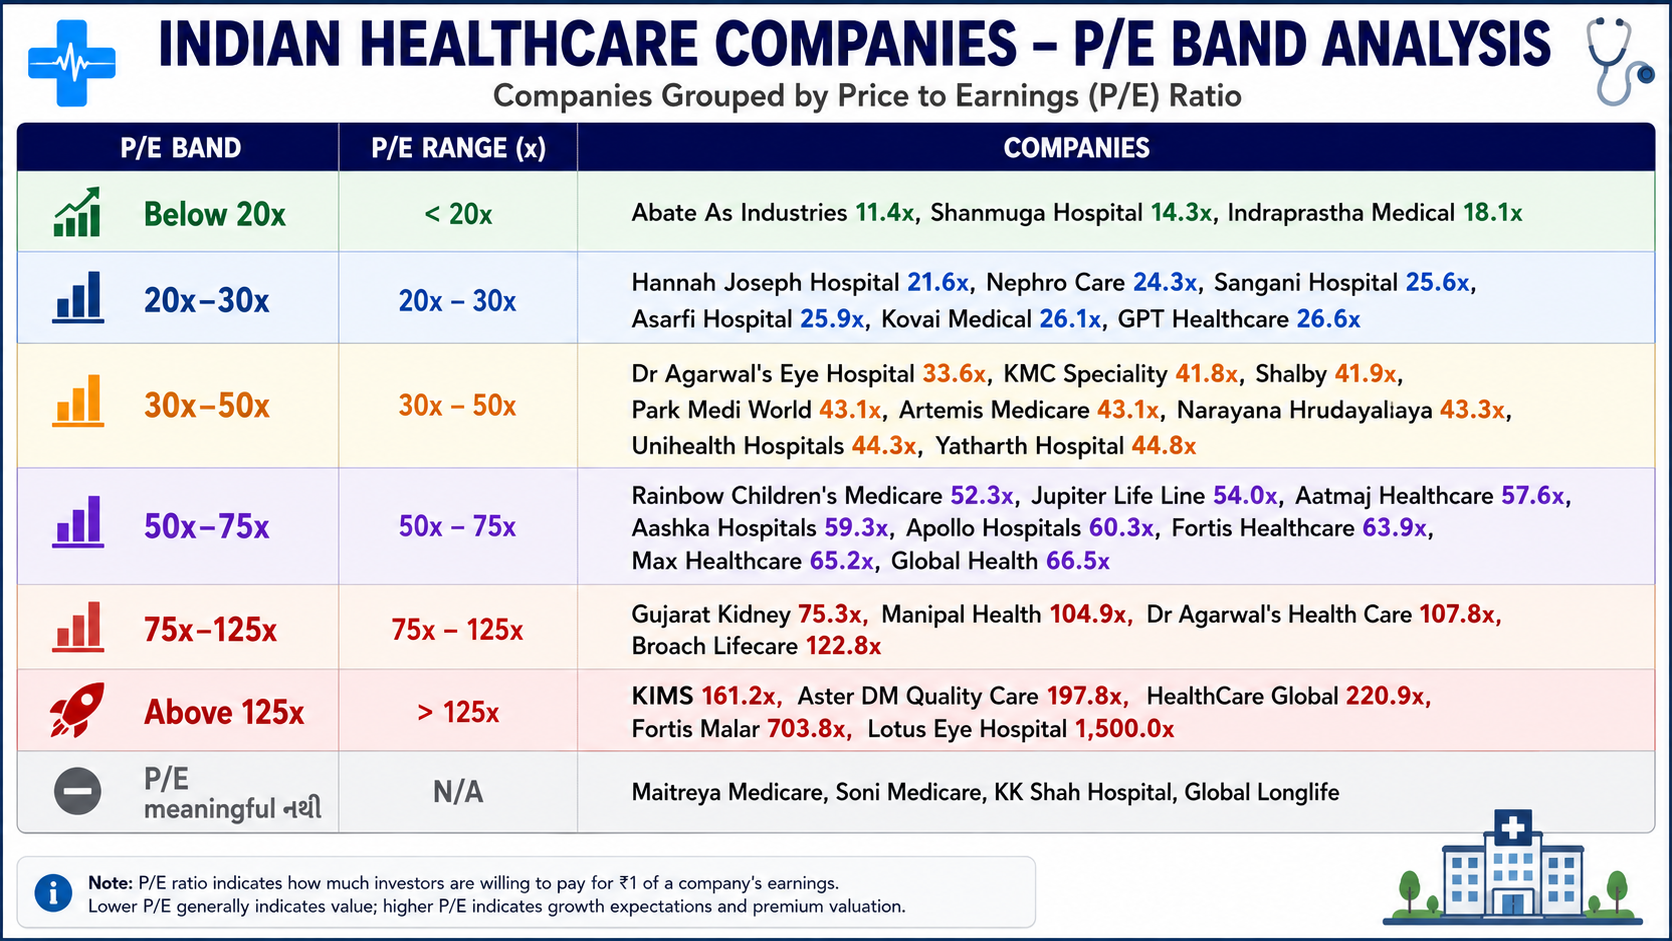
Fortis Malar અને Lotus Eye Hospital જેવા ખૂબ ઊંચા P/E ધરાવતા નાના stocksમાં tiny earnings base અથવા special corporate circumstances multipleને distort કરી શકે છે. તેથી headline P/Eને standalone investment signal તરીકે જોવું યોગ્ય નથી.
Growth સામે valuation: કોને શું price-in થયું છે?
Hospital sector માટે macro picture અસાધારણ રીતે supportive છે. FY30 સુધી healthcare delivery market ₹11.2–12.2 લાખ કરોડ, private providersનો share લગભગ 69%, large private hospitalsનું penetration માત્ર 20% અને non-metro marketsનો share 75–80%—આ ચાર આંકડા organised hospital chains માટે લાંબા growth runway તરફ ઈશારો કરે છે.
Operating performance પણ valuationને support કરે છે. Listed hospitalsની combined revenue છેલ્લા 2 વર્ષમાં લગભગ 19% CAGR, EBITDA 24% CAGRથી વધ્યું છે અને લગભગ 8,000 beds ઉમેરાયા છે. પરંતુ આ growth સામે hospital valuations પણ લગભગ 51% વધી ચૂક્યા છે.
અહીંથી sector બે ભાગમાં વહેંચાય છે.
Apollo Hospitals, Fortis Healthcare અને Global Health જેવા stocks premium valuation ધરાવે છે, પરંતુ current earnings અને capacity growth તેને એક હદ સુધી support કરે છે.
Max Healthcareમાં quality premium વધુ છે અને future execution માટે marketની અપેક્ષા ઊંચી છે.
Manipal Health, KIMS અને Aster DM Quality Careમાં growth runway મોટો છે, પરંતુ current P/E સૂચવે છે કે તેનો મોટો હિસ્સો પહેલેથી price-in થઈ ગયો છે.
બીજી તરફ Narayana Hrudayalaya, Park Medi World, Kovai Medical, GPT Healthcare અને Indraprastha Medical જેવા stocks sector-relative basis પર lower valuation આપે છે. જોકે lower multiple પાછળ scale, liquidity, geography અથવા growth visibilityની મર્યાદા પણ હોઈ શકે છે.
હવે sector story નહીં, stock-selectionની story
ભારતીય hospital industryમાં structural growth અંગે શંકા ઓછી છે. Rising incomes, insurance penetration, complex diseases, private-sector share, non-metro expansion અને industry consolidation આગામી ઘણા વર્ષ સુધી sectorને growth આપી શકે છે. Manipal Healthના RHPના CRISIL figures આ structural opportunityને વધુ સ્પષ્ટ કરે છે.
પરંતુ share-market return માટે માત્ર industry growth પૂરતી નથી.
જ્યારે listed hospitals પહેલેથી લગભગ 28x EV/EBITDA, large chains 34x અને અનેક leading stocks 60–200x P/E પર ટ્રેડ કરી રહ્યા હોય ત્યારે આગામી re-rating માટે companiesએ માત્ર beds ઉમેરવા નહીં પરંતુ beds ઝડપથી operational કરવાના, occupancy વધારવાની, ARPOB સુધારવાનો અને EBITDA growth deliver કરવાનો રહેશે.
Hospital stocksમાં હવે સૌથી મહત્વનો પ્રશ્ન છે:
કઈ company સૌથી ઝડપથી વધશે? એ સવાલ નથી, પરંતુ કઈ કંપનીની વૃદ્ધિ માટે બજારે પહેલેથી જ પ્રીમિયમ ચૂકવી દીધું છે? તે સવાલ મહત્ત્વનો છે.
Disclaimer - અહીં આપવામાં આવેલી માહિતી માત્ર જાણકારી અને શૈક્ષણિક હેતુ માટે છે. તેને કોઈપણ શેર, સિક્યોરિટી અથવા નાણાકીય પ્રોડક્ટ ખરીદવા કે વેચવાની સલાહ અથવા ભલામણ તરીકે ન ગણવી. રોકાણ બજારના જોખમોને આધીન છે. કોઈપણ રોકાણ અથવા નાણાકીય નિર્ણય લેતા પહેલાં તમારી નાણાકીય સ્થિતિ, રોકાણના હેતુ અને જોખમ લેવાની ક્ષમતાનું મૂલ્યાંકન કરો અને અધિકૃત નાણાકીય સલાહકારની સલાહ લો.
Share Link

Advertisement by KuberaNow
Market
See more- શું ઈદ-એ-મિલાદ અને રક્ષાબંધનના દિવસે શેરબજાર ખુલ્લું રહેશે ?
- Sensex 200 પોઇન્ટ તૂટ્યો તો Nifty 24,150ની નીચે, Metal-IT શેરોમાં વેચવાલી
- Stocks In News | 25 August 2026: આજે કયા Top Share ફોકસમાં રહી શકે
- ઇરાન પર પ્રતિબંધ, ક્રૂડના ઊંચા ભાવે સેન્ટિમેન્ટ બગાડ્યું, સેન્સેક્સ 171 પોઇન્ટ ડાઉન અને નિફ્ટી 32 પોઇન્ટ ઘટ્યો
Economy
See more- મંદીમાં પણ મોંઘી ઘડિયાળ અને જ્વેલરીની માંગ કેમ રહે છે? Luxury Marketનું ગણિત
- કેપિટલ ગૂડ્સ સેક્ટરની કામગીરી પહેલા અર્ધવાર્ષિક સમયગાળામાં નબળી, બીજા ભાગમાં રિકવરીની આશા
- ભારતીય બેન્કોની ધિરાણવૃદ્ધિ મજબૂતઃ પ્રથમ ક્વાર્ટરમાં 20 ટકાની વૃદ્ધિ
- ભારતનું વેપાર નેટવર્ક બનશે વધુ વિશાળ, વિશ્વ વેપારના 75% સુધી પહોંચવાનો માર્ગ ખુલશે

Advertisement by KuberaNow
Personal Finance
See moreMORNING BRIEF
Get the top 5 business stories before markets open — delivered to your inbox at 7:30 AM IST.
- 24,000+ readers
- Daily 7:30 AM